Carlo Sandrin
CEO
Cledar and Neuro Data help a government department use predictive data analytics and data modeling to shape economic policy after a natural disaster.

Country
United States
Industry
Government / Public sector
Duration
9 months
Hurricane Maria, a category-5 hurricane, battered the Caribbean in September 2017. It is regarded as the worst national disaster to living memory. Faced with the challenge of rebuilding the economy, the department of economic development for one island needed to reform its tax policy in order to secure sufficient revenue for government-planned activities, while at the same time, providing economic relief to the island’s inhabitants and businesses. The government authorities of the island enlisted the support of a leading global consulting firm, which contracted Neuro Data and Cledar to devise and build a solution.
data points
worth of budget analyzed
of historical data
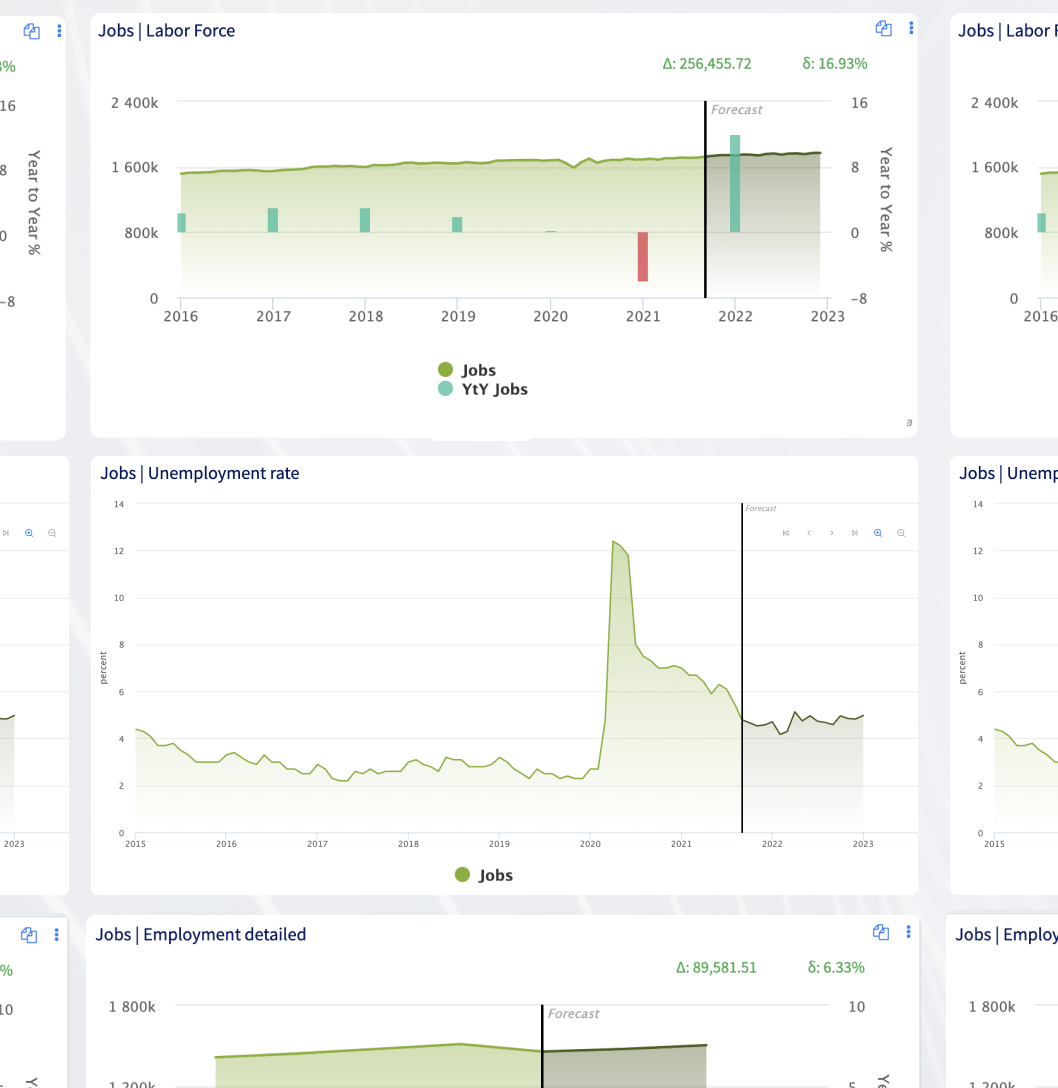
Cledar’s goal within the scope of collaboration was to use data modeling and predictive analytics to forecast and accurately simulate the different implications of various economic scenarios. For example, what impact could the departure of the island’s three largest pharma companies have on unemployment, tax revenue, and the overall economic situation on the island? In order to support the local government effectively, Cledar sought to bring together all the different data that could be relevant.
This meant bringing together more than 900 different sets, from a variety of different sources and in a range of different formats, such as Excel spreadsheets and PDF reports. This would require data to be read, parsed, and transformed into a uniform format, that could then be probed, compared and analyzed. Inconsistencies in how data had been reported historically meant that, in some cases, it was difficult to build a clear picture.
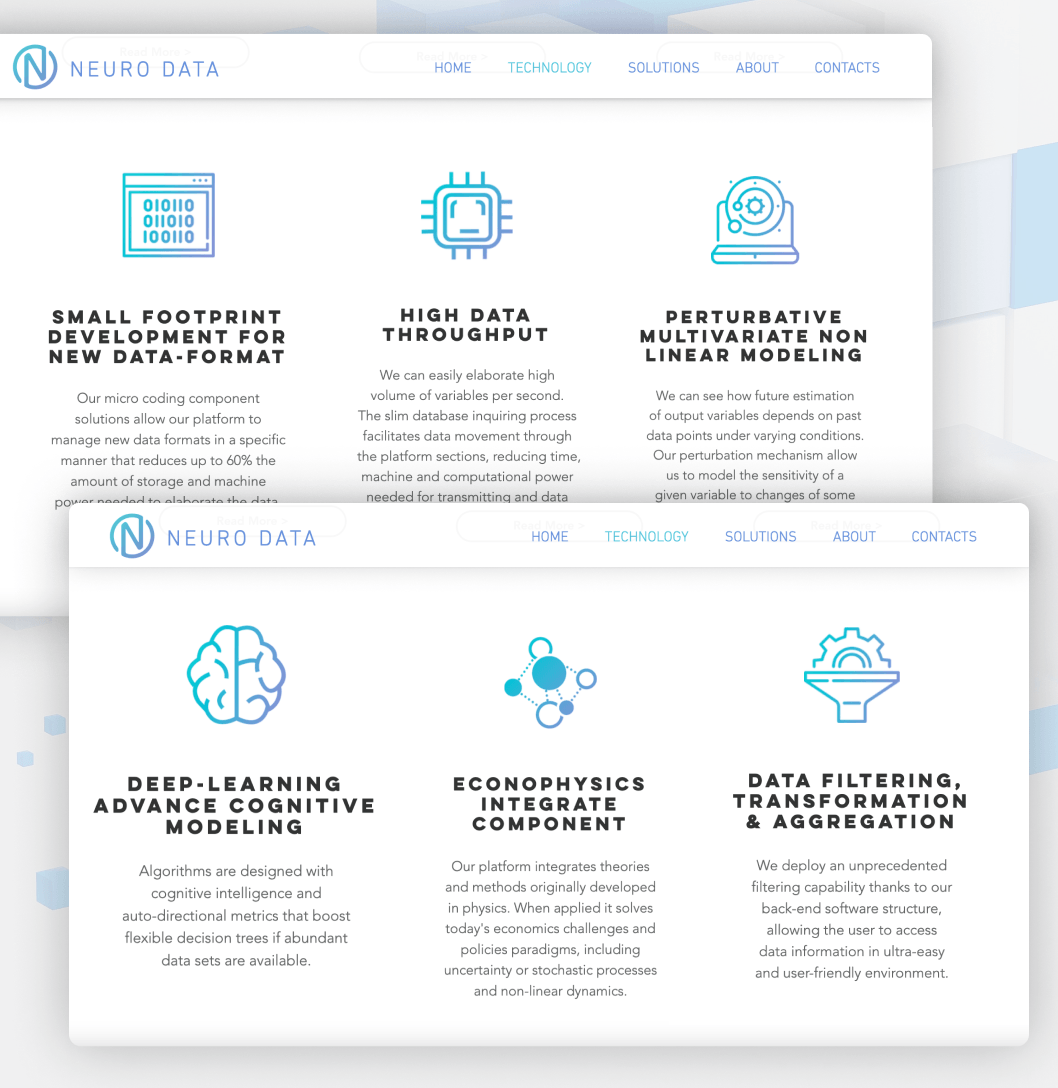
Equipped with a raft of data relevant to economic performance and having developed a toolset to make the data usable, Cledar created custom software that enabled all of this data to be presented via a single user interface. What’s more, it enabled breakdown, deeper dives and comparisons between different types, categories and sources of data, thereby opening up a variety of data analysis and data modeling opportunities.
The second major part of the solution was to develop a forecasting algorithm based on singular value composition. The tool featured intuitive UI features, such as timeline slider, which enabled users to understand the economic and demographic implications of a variety of different scenarios.
Using the software application developed by Cledar, the island’s department of economic development was better able to understand the likely outcomes of a variety of possible events, such as the departure of a major company and its knock-on effects on other business, unemployment, and tax revenue. Equipped with this tool, the island’s authorities were able to validate existing theories and make decisions related to economic policy in a more-informed way than had previously been possible.
Cledar has demonstrated its ability to use a variety of sources and types of data to make accurate predictions. Furthermore, the solution developed by Cledar in the aftermath of this natural disaster was later deployed by a city in the US Midwest to better understand the relationship between a variety of factors, such as crime, housing prices, school funding and others, and to inform decisions intended to bring about positive change.